


For families asking how much will college cost in 10 years, the answer arriving from the data is sharper than most expect: the average private non-profit university is projected to charge more than $63,000 per year in tuition and fees alone by 2036, a 48% increase over today's rates. From November 2025 through March 2026, the StraighterLine research team analyzed tuition and fee data from four primary sources: the College Board,1 the Western Interstate Commission for Higher Education (WICHE),2 the Education Data Initiative (sourced from the National Center for Education Statistics),3 and the Cato Institute.4 To project costs for 2036, we applied a conservative 4% compound annual growth rate (CAGR) to 2025-26 tuition baselines. Historical annual tuition increases have ranged from 2% to 5% depending on institution type; 4% represents the long-term average and the conservative midpoint. All figures reflect tuition and required fees only and do not include room, board, books, or other expenses.
How Tuition Compounds Year Over Year Between Now and 2036
For students currently enrolled or planning to enroll, the timeline matters as much as the destination. The line chart below shows how public four-year in-state tuition is projected to grow each biennial interval through 2036. The dollar increase at each step grows larger even though the percentage stays constant, because 4% applied to a larger base produces a larger absolute result each cycle.
Year-over-year tuition trajectory: public 4-year in-state (2026-2036)
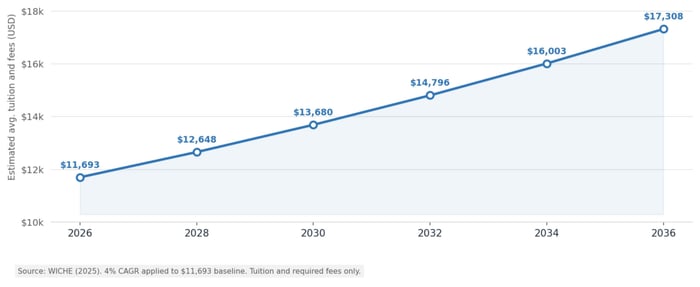
Note: Tuition and required fees only.
Key Takeaways
- The 2026-2028 interval adds $955 to annual tuition. The 2034-2036 interval adds $1,305. The same percentage rate produces a larger dollar burden each cycle.
- A student who delays enrollment from 2026 to 2030 faces $1,987 more per year in tuition at the same in-state institution.
- Over a standard four-year degree, a student starting in 2036 will pay approximately $13,760 more in tuition and fees than a student who started the same degree at the same school in 2026.
- These figures reflect tuition and required fees only. Total cost of attendance including room, board, and books would be substantially higher.
The Student Loan Debt Trajectory
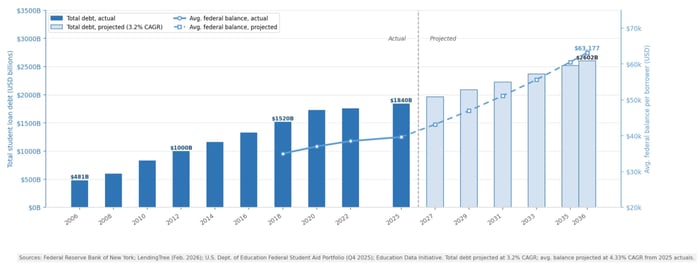
The chart below shows total outstanding U.S. student loan debt and the average federal balance per borrower from 2006 through 2025, with both measures projected forward to 2036 at their historical compound annual growth rates.
U.S. student loan debt
Key Takeaways
- Total U.S. student loan debt reached $1.84 trillion in late 2025, more than tripling from $481 billion in 2006 as rising tuition outpaced state support and grant aid.
- At 3.2% annual growth, total outstanding U.S. student loan debt is projected to reach $2.6 trillion by 2036, an increase of $760 billion over the 2025 balance of $1.84 trillion.
- The average federal student loan balance per borrower was $39,633 as of December 2025, according to the U.S. Department of Education.
- At the historical CAGR of 4.33% annual growth, the average federal student loan balance per borrower is projected to reach approximately $62,000 by 2036, nearly matching the projected annual tuition at a private non-profit institution in the same year.
- Student loan delinquency surged to 9.57% of balances 90 days or more past due in Q4 2025, up from 0.53% one year earlier, as pandemic forbearance ended against an existing debt load that has grown for nearly two decades.
- 47% of Class of 2024 bachelor's degree recipients from four-year public and private nonprofit colleges graduated with student loan debt, averaging $29,560.
- The debt trajectory is not a temporary anomaly. Since 1980, net tuition revenue per FTE has increased in every state except Nevada, and the borrowing patterns that follow from those increases show no structural reversal.
What College Will Cost in 10 Years, by Institution Type
The chart below shows 2025-26 average tuition and fees alongside 2036 projections for five institution types, with each bar pair showing the dollar gap a student entering today versus in 10 years would face.
Average annual tuition and fees projections by institution type
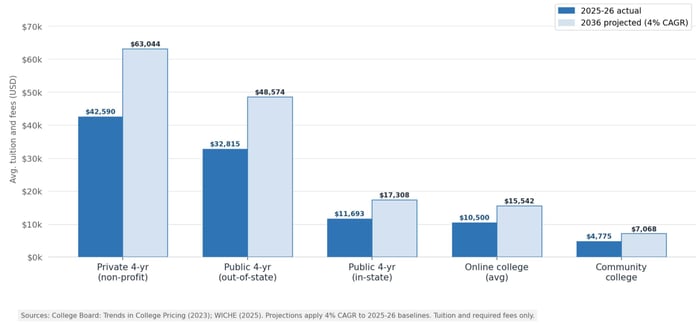 Note: Tuition and required fees only.
Private non-profit four-year costs are projected to cross $63,000 per year by 2036. That figure covers tuition and required fees only, before room, board, or books. Even in-state public tuition is projected to reach $17,308, a 48% increase over current figures. The absolute dollar gap between institution types widens significantly because the same percentage increase applied to a larger base produces a far larger absolute burden each year.
Key Takeaways
- All five institution types are projected to cost 48% more in 2036 than today, regardless of starting price.
- Private non-profit tuition crosses $63,000/year by 2036: tuition and fees only, before room, board, or books.
- Even the lowest-cost traditional path (community college) rises from $4,775 to $7,068/year, a $2,293 increase.
- The absolute dollar gap widens sharply: private costs rise $20,454 over 10 years vs. $2,293 at community college.
How U.S. Tuition Compares to Other OECD Countries
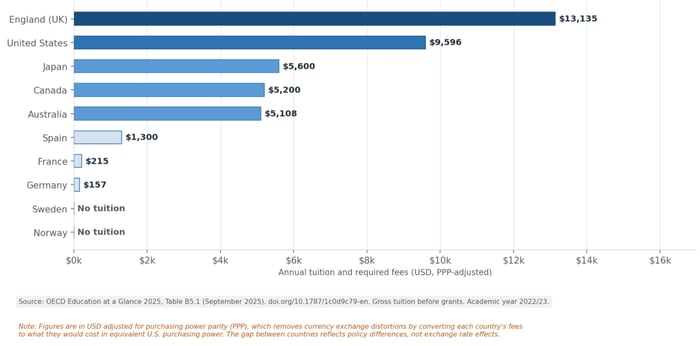
The chart below shows annual tuition and required fees at public bachelor-level institutions across selected OECD countries in nominal USD, placing the U.S. figure in direct international context.
Annual tuition fees at public programs
 Key Takeaways
- Norway, Sweden, Germany, and Finland charge zero or near-zero tuition at public universities, funding tertiary education through general taxation rather than individual student fees.
- The U.S. public university average of approximately $11,580 per year (PPP-adjusted) places it near the top of the OECD ranking for public institution fees, behind only England at approximately $12,330.
- At private institutions, U.S. students face the highest published tuition fees of any OECD country.
- The high-fee U.S. model is paired with significant financial aid: 80% of U.S. students received public grants, scholarships, or government-guaranteed loans in 2019-20, the fourth-highest share among OECD countries with available data. However, as the debt trajectory in the previous section shows, that aid has not offset cost growth for most borrowers.
- The gap between U.S. public university fees and the OECD median is not narrowing. Most peer economies have held public university costs relatively stable while U.S. tuition has continued its long-term upward trajectory.
- The OECD explicitly frames the U.S. as a high-tuition, high-aid system. That model generates the highest student debt loads in the OECD as a structural consequence, not an accident.
Where College Costs Are Headed: A 2036 Ranking by Institution Type
The chart below ranks all five institution types from highest to lowest projected 2036 cost, showing the cost ceiling each enrollment decision carries.
2036 projected tuition by college type, ranked by cost
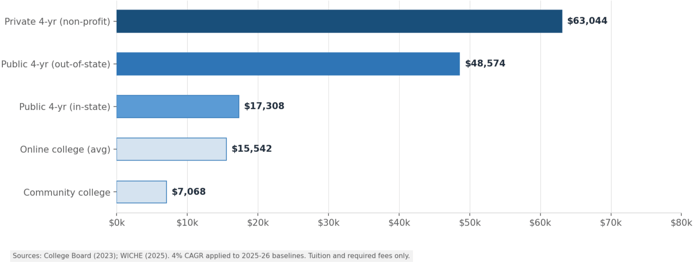 Notes: Tuition and required fees only.
Key Takeaways
- Private non-profit tuition ($63,044) is projected to cost nearly 9x more than community college ($7,068) by 2036.
- The single largest gap in the ranking falls between public out-of-state ($48,574) and public in-state ($17,308): a $31,266 difference that makes residency one of the highest-value financial decisions a student can make.
- Online college ($15,542) and public in-state ($17,308) will be the two most cost-comparable options by 2036, within $1,766 of each other.
How Fast Has College Tuition Grown Historically?
The chart below tracks cumulative growth of public four-year in-state tuition against general CPI from 2003 to 2023, showing how consistently tuition has outpaced general inflation over two decades.
Cumulative growth from 2003 baseline: public 4-yr tuition vs. general CPI
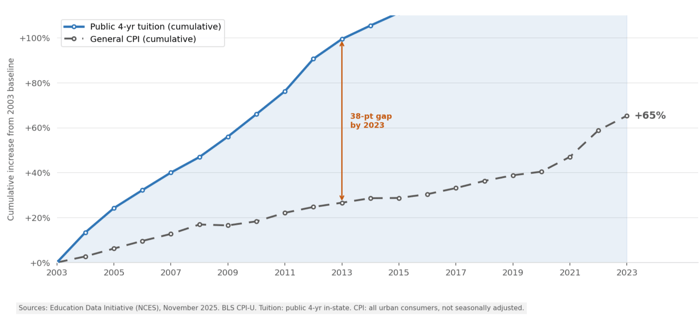 Tuition has not simply kept pace with inflation. It has outpaced it by a compounding margin for two decades. Even in the low-growth period following 2015 and the near-stall of 2020-21, costs still increased. The 4% CAGR applied in the 2036 projections reflects the long-term average for public institutions, and is meaningfully lower than the average rate for the 2003-2012 period.
Key Takeaways
- Tuition grew +93% from 2003 to 2023 against +55% for general inflation over the same period, a 38-point gap that has never closed in the 20-year record.
- The steepest growth occurred between 2003 and 2012, with annual rates of 6-13%. That period alone accounts for the majority of the cumulative gap between tuition and CPI.
- Even in the near-stall of 2020-21, when tuition grew just 0.27%, costs still increased. There is no year of decline in this dataset.
- This persistent outpacing of general inflation is why the 4% CAGR used in the 2036 projections is a conservative estimate, not an aggressive one.
Why College Keeps Getting More Expensive: State Funding and the Shift to Students
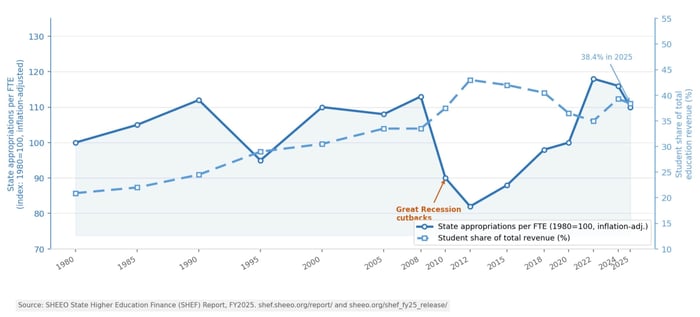
The chart below tracks inflation-adjusted state appropriations per FTE student against the student share of total public higher education revenue from 1980 to 2025, showing how closely the two lines move in opposite directions.
State Funding and the Shift to Students
 Key Takeaways
- The student share of total public higher education revenue rose from 20.9% in 1980 to 38.4% in 2025, nearly doubling over four decades as state appropriations per student declined in real terms.
- When state funding falls after recessions, tuition rises to compensate. The pattern has repeated after the 2001 downturn, the 2008 financial crisis, and is showing early signs of repeating again as enrollment recovers and per-student appropriations come under pressure.
- FY2025 saw the first per-student funding decline since 2012, with inflation-adjusted appropriations falling 1.0% to $12,082 per FTE. The cause was not a state budget cut but enrollment growth outpacing spending increases.
- Since 1980, net tuition revenue per FTE has increased in every state except Nevada and has more than doubled in 41 states.
- In 18 states, student tuition and fees still comprise more than 50% of total public higher education revenue, meaning those states fund their public universities more like private institutions than traditional public ones.
- The 4% CAGR applied in this article's 2036 projections reflects this structural dependence on tuition revenue, not simply general price inflation.
How Much Will College Cost in 10 Years: What it Means Today
College costs have outpaced general inflation for decades, and the data suggests that trend will continue. The structural forces behind the 2036 projections in this article, declining state appropriations, rising student debt loads, and a pricing gap that keeps widening against most OECD peers, show no signs of reversing. For students asking how much will college cost in 10 years, the answer is: significantly more than it does today, at every institution type, with compounding consequences for total degree cost and borrowing.
Understanding the full cost trajectory is the first step toward navigating it. Students who earn transferable college credits through lower-cost alternatives before enrolling full-time can reduce their total degree cost significantly. StraighterLine offers more than 80 ACE-recommended online courses at under $30 per credit hour equivalent, with no deadlines, no waitlists, and no required start dates. Credits transfer to 3,000+ accredited colleges and universities.
Explore our course catalog to see how much you can save on tuition.!
References
- College Board: Trends in College Pricing and Student Aid (2023). https://research.collegeboard.org/trends/college-pricing
- WICHE: Tuition and Fees in Public Higher Education in the West 2025-26 (November 2025). https://www.wiche.edu/wp-content/uploads/2025/11/2025-Tuition-and-Fees-WICHE-v5.pdf
- Education Data Initiative: College Tuition Inflation Rate, sourced from NCES (November 2025). https://educationdata.org/college-tuition-inflation-rate
- Cato Institute: Trends in Higher Education: State Funding, Tuition Revenue, and Public Colleges, 1980-2023 (November 2024). https://www.cato.org/briefing-paper/trends-higher-education-state-funding-tuition-revenue-public-colleges-1980-2023
- Bureau of Labor Statistics: Consumer Price Index, All Urban Consumers. https://www.bls.gov/cpi/
- SHEEO: State Higher Education Finance (SHEF) Report, FY2025 (2025). https://shef.sheeo.org/report/
- SHEEO: State Higher Education Finance (SHEF) FY2025 Press Release (2025). https://sheeo.org/shef_fy25_release/
- SHEEO: State Higher Education Finance (SHEF) Report, FY2024 (2024). https://sheeo.org/shef_fy24/
- LendingTree: U.S. Student Loan Debt Statistics (February 2026). https://www.lendingtree.com/student/student-loan-debt-statistics/
- Federal Reserve Bank of New York: Student Debt. https://www.newyorkfed.org/microeconomics/topics/student-debt
- U.S. Department of Education Federal Student Aid: Portfolio Summary (Q4 2025). https://studentaid.gov/data-center/student/portfolio
- Education Data Initiative: Average Student Loan Debt (2026). https://educationdata.org/average-student-loan-debt
- Education Data Initiative: Student Loan Debt Statistics (2026). https://educationdata.org/student-loan-debt-statistics
- Federal Reserve Board: Report on the Economic Well-Being of U.S. Households in 2024, Higher Education and Student Loans (May 2025). https://www.federalreserve.gov/publications/2025-economic-well-being-of-us-households-in-2024-higher-education-and-student-loans.htm
- OECD: Education at a Glance 2025 (September 2025), Chapter B5: How is tertiary education financed? https://www.oecd.org/en/publications/2025/09/education-at-a-glance-2025_c58fc9ae/full-report/how-is-tertiary-education-financed_2845d742.html
- OECD: Education at a Glance 2024 (September 2024). https://doi.org/10.1787/c00cad36-en
- Education Data Initiative: Average Cost of College by Country (2025). https://educationdata.org/average-cost-of-college-by-country
- American Council on Education / Higher Education Today: OECD on U.S. Higher Ed (October 2024). https://www.higheredtoday.org/2024/10/21/oecd-on-u-s-higher-ed/